UC Berkeley | Institute of Governmental Studies: Californians initially back Governor Newsom’s proposed redistricting ballot measure 48% to 32%, but many voters are undecided.

Poll finds Newsom’s standing with voters is also on the rise.
by Mark DiCamillo, Director, Berkeley IGS Poll
The latest Berkeley IGS Poll included a short two question series about the possibility of California holding a special election in November to redraw its congressional districts to favor Democratic candidates to counter Texas’s plan to do the same in favor of GOP candidates. The first question asked voters whether they thought holding such an election would be a good idea or bad idea, while the second asked voters how they would vote on a redistricting ballot measure, which is likely to appear as Proposition 50 on the November statewide special election ballot, if the election were held today.
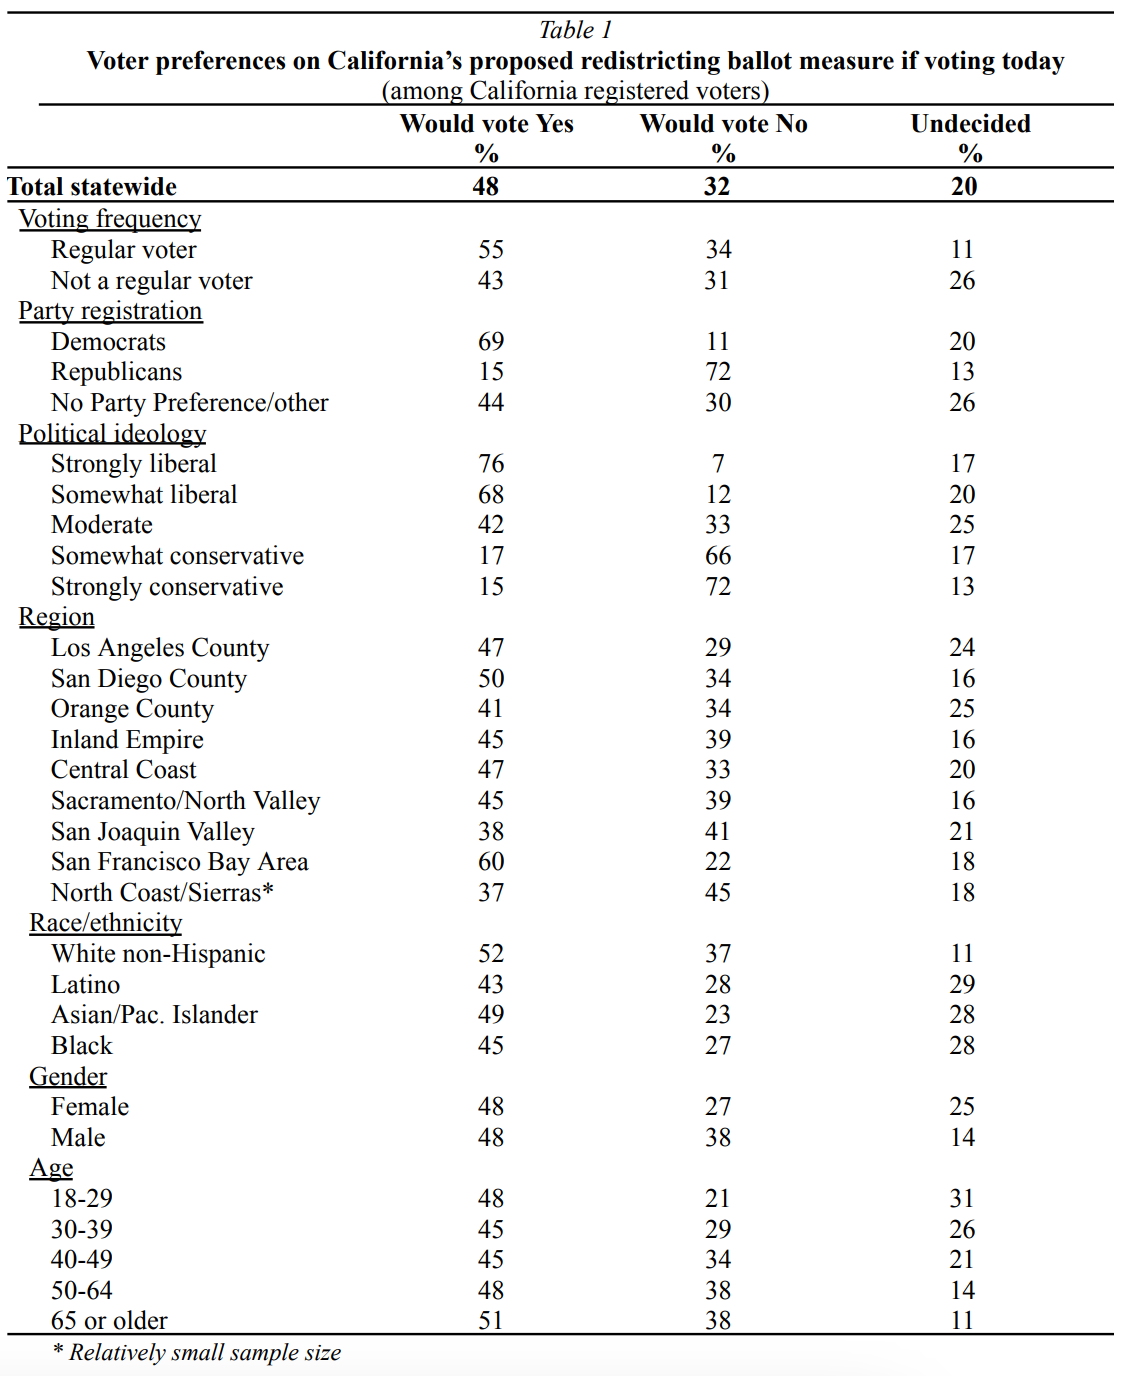
The results to both questions are similar, with more voters describing the proposal to go forward with the redistricting vote a good idea (46%) than a bad idea (36%). And, when asked how they would vote on the measure in a statewide special election, 48% say they would vote Yes, while 32% would vote No, although a sizeable proportion (20%) are undecided.
Huge partisan differences characterize voting preferences, with Democrats in support nearly seven to one (69% to 11%), while Republicans are overwhelmingly on the No side 72% to 15%. Significantly, those who regularly vote in statewide elections, defined as those who according to their voting record have voted in at least 5 of the last 7 statewide elections, are backing the measure by a wider margin than the overall electorate, with 55% of these voters voting Yes and 34% voting No.
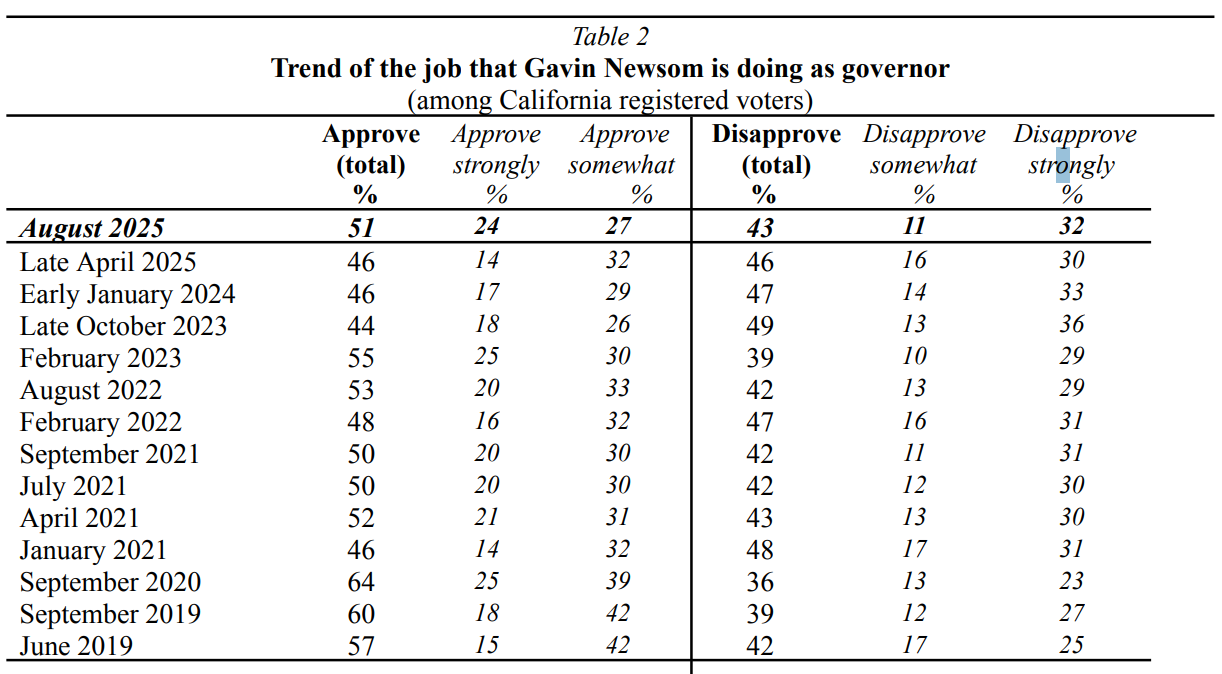
The poll also finds that the job marks that voters now give to Governor Gavin Newsom, the redistricting measure’s chief proponent, are on the rise, as more Californians now approve than disapprove of his performance by a 51% to 43% margin. This eight-point positive assessment compares to an evenly divided 46% approve and 46% disapprove rating that Newsom received in a Berkeley IGS Poll completed four months ago in April.
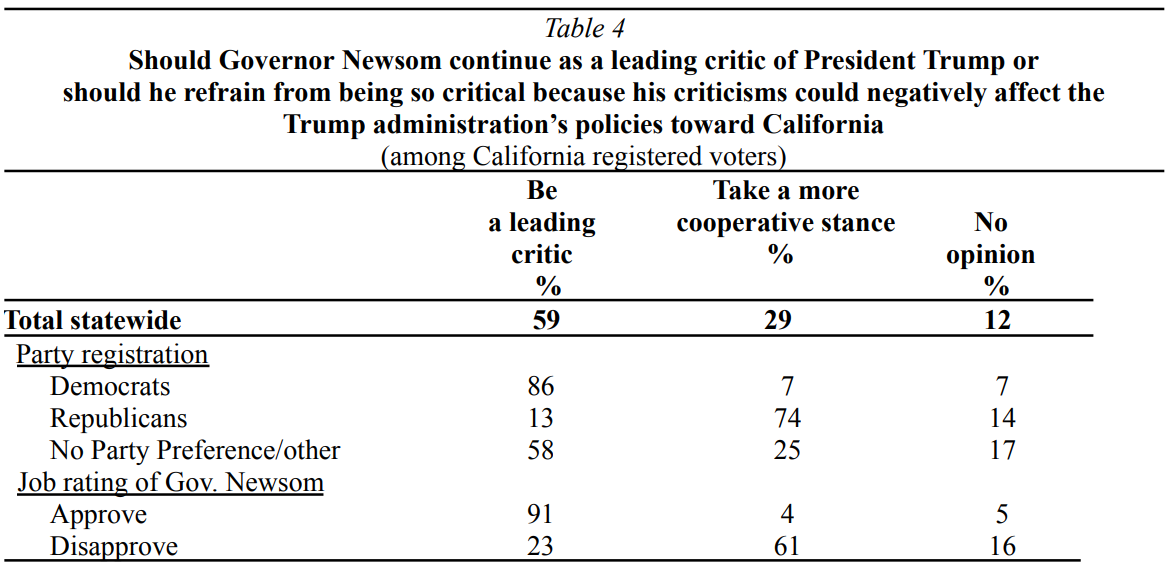
One factor that appears related to the recent uptick in the governor’s job rating is that by a two-to-one margin Californians support Newsom’s taking a much more vocal stance in criticizing President Donald Trump and his administration’s policies toward California.
These findings come from the latest Berkeley IGS Poll conducted online in English and Spanish August 11-17, 2025 among a stratified random sample of 4,950 registered voters across the state. Observed IGS co-Director Eric Schickler, “The results suggest that the redistricting initiative starts out with relatively strong support. Even so, with 20% of registered voters’ undecided, there is considerable uncertainty about what will happen in November. This will be an intense campaign with both sides spending tens of millions to try to move those undecided voters.”
Californians are backing the redistricting ballot measure 48% to 32%, although many are undecided
While the redistricting ballot measure is backed 48% to 32% among the overall electorate, it receives greater support among voters who regularly vote in statewide elections. Among this key segment of voters, 55% say they would be inclined to vote Yes if the election were held today, while 34% would vote No. Just 11% of these voters are undecided.
Huge partisan and ideological differences characterize voting preferences toward the redistricting ballot measure among the overall electorate. Democrats are currently on the Yes side nearly seven to one (69% to 11%), while Republicans are voting No 72% to 15%. Non-partisans initially back the proposal 44% to 30%, although many (25%) are undecided.
Liberals are also highly supportive of the ballot measure, with three in four of voters identifying as strongly liberal in politics voting Yes. This contrasts with the views of strongly conservative voters, about seven in ten of whom oppose the measure.
The poll also finds some significant regional variations in voter support on the redistricting measure. Yes-side support is strongest in the San Francisco Bay Area, with voters there initially in favor by a nearly three-to-one margin. By contrast, narrow pluralities of voters in the San Joaquin Valley and North Coast/Sierras region are lining up on the No side.
While the poll generally finds most major demographic subgroups of the electorate supporting the redistricting ballot measure, there are considerable variations in the proportions who are undecided across voter segments. For example, while just 11% of white voters say they are currently undecided on the redistricting measure, among the state’s Latino, Black, and Asian American voters, nearly three in ten are undecided.
Governor Newsom’s job ratings on the rise in California
The proposal to have California redraw its district lines in advance of next year’s mid-term election is being strongly promoted by Governor Newsom, and as such, the outcome of the election could turn in large measure on how credible and effective he is in persuading voters to turn out and support the measure.
The poll finds relatively good news for Newsom on this front, as an increasing proportion of voters now approve of the job he is doing as governor. At present, 51% of the state’s voters now approve of Newsom’s performance overall, while 43% disapprove. This eight-point positive assessment compares to a more evenly divided 46% approve and 46% disapprove rating that Newsom received in a Berkeley IGS Poll conducted four months ago in April.
The poll also finds that the largest increase in voter approval of Newsom is coming from those who say they strongly approve of him, which has grown from just 14% in April to 24% in the latest poll
Variations in Newsom’s job ratings across major subgroups of the electorate
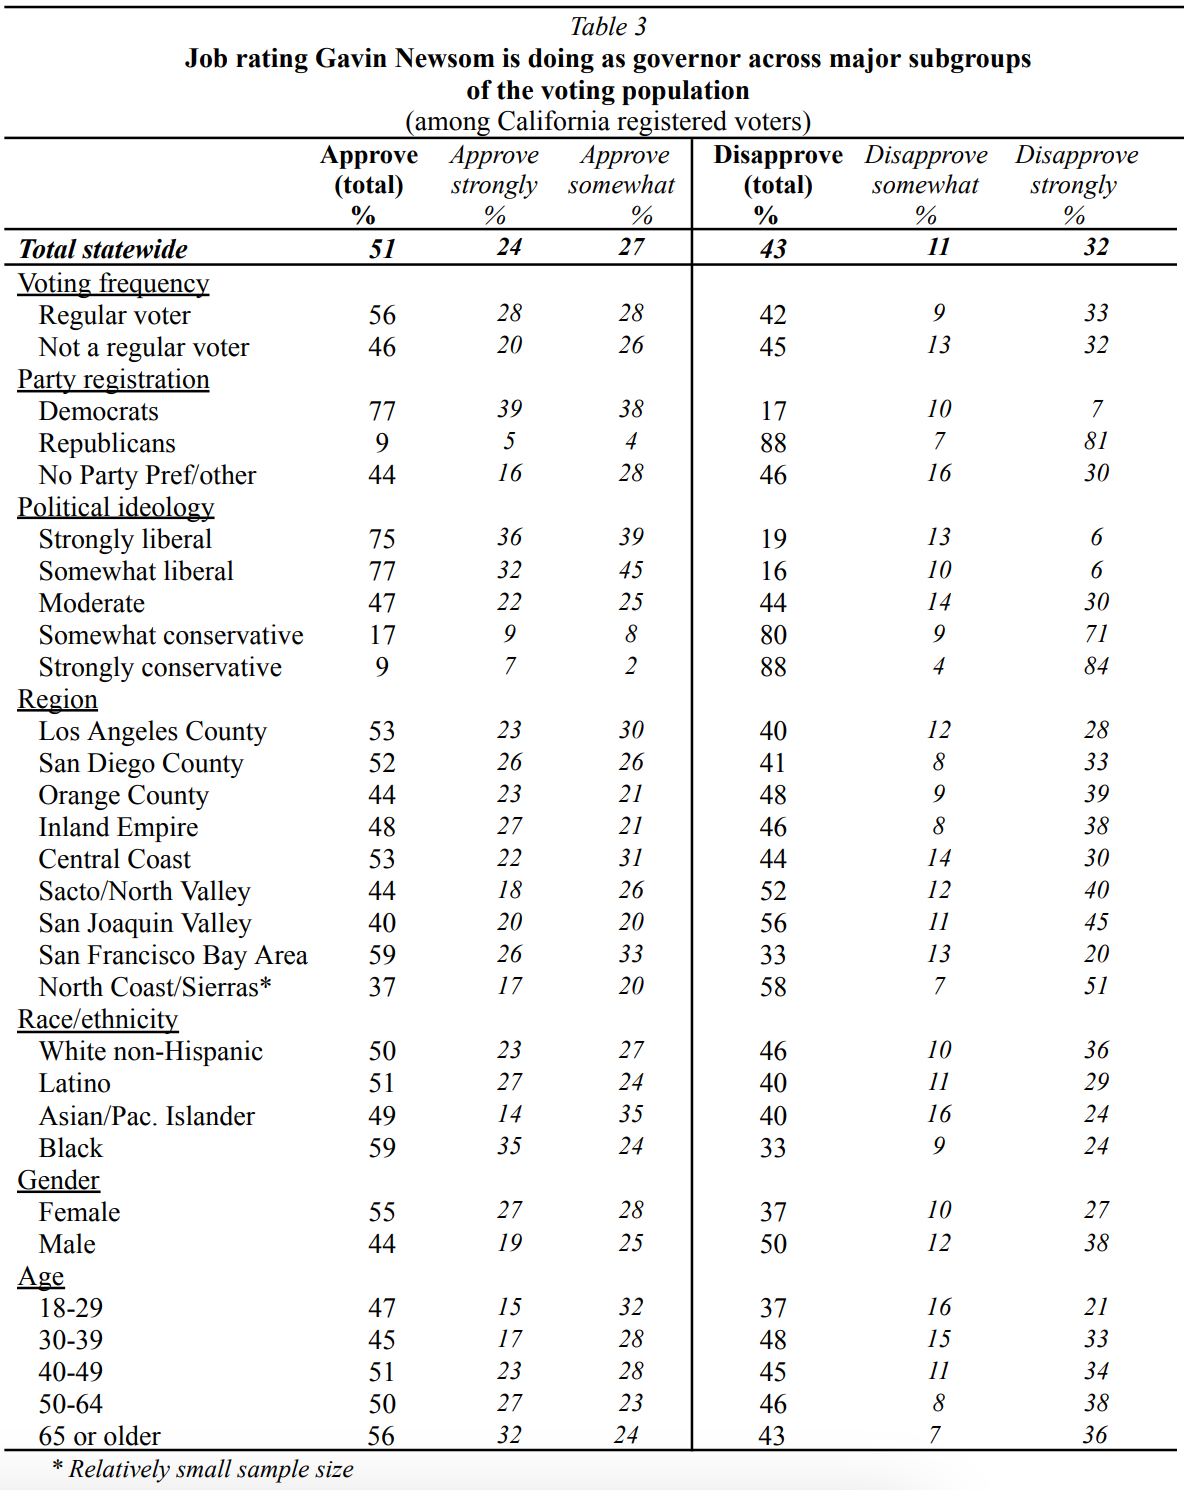
While Newsom’s job rating among the overall electorate is now eight points above water, this increases to fourteen points among voters who regularly vote in statewide elections, with 56% of these voters approving and 42% disapproving of the governor’s performance.
Newsom has long been viewed by voters through a highly partisan prism, and the current poll again shows this to be the case. Registered Democrats among the overall electorate now rate him positively by a 77% to 17% margin, while Republicans are nearly unanimous in their disapproval, 88% to 7%, 81% of whom disapprove strongly.
There is a similarly wide chasm between liberals and conservatives., with about three in four of the state’s liberals offering a positive assessment of the governor’s performance, while greater than eight in ten conservatives do not, most of whom strongly disapprove.
On a regional basis, Newsom receives somewhat higher job marks among voters in Los Angeles County, San Diego County, the Central Coast and the San Francisco Bay Area, where majorities approve. By contrast, the governor’s ratings are underwater among voters in Orange County, and in both the Sacramento and San Joaquin Valley regions, as well as among voters in the sparsely populated counties of the state’s North Coast/Sierras region.
The poll also finds a gender gap in Newsom’s current job marks, with female voters rating him positively 55% to 37%, while males view him negatively 50% to 44%.
Most Californians support Newsom’s more vocal criticisms of President Trump
In recent months Newsom has become much more vocal in his criticisms of President Donald Trump and the effect his administration’s policies are having on California. Because of this, the latest poll asked voters whether they felt it was better for the governor to continue to be among the president’s leading critics or whether it would be better for the state to have him take a more cooperative stance. The results are quite one-sided, with twice as many voters supporting Newsom’s positioning himself as a leading critic of the president over his taking a more cooperative stance 59% to 29%. Voters who approve of Newsom’s job performance are nearly unanimous in supporting the governor taking on the role as a leading critic of the president, 91% to 4%.
About the Survey
The findings in this report are based on a Berkeley IGS Poll completed by the Institute of Governmental Studies (IGS) at the University of California, Berkeley. The poll was administered online in English and Spanish August 11 – 17, 2025, among a stratified random sample of 4,950 California registered voters. Funding for the poll was provided in part by the Los Angeles Times.
Data collection for the poll was completed by distributing email and text message invitations to stratified random samples of the state’s registered voters. Each email or text invited voters to participate in a non-partisan survey conducted by the University and provided a link to the IGS website where the survey was housed. Reminders were distributed to non-responding voters and an opt out link was provided for voters not wishing to receive further email invitations.
Samples of the state’s registered voters were provided to IGS by Political Data, Inc., a leading supplier of registered voter lists in California and were derived from information contained on state and local voter registration rolls, which are public documents. The sample was stratified by age and gender to obtain a proper balance of survey respondents.
To protect the anonymity of respondents, the personally identifiable information of each voter that was listed on their voting record was purged from the data file and replaced with a unique and anonymous identification number during data processing. In addition, after the completion of data collection, post-stratification weights were applied to the survey data file to align the sample of registered voters to population characteristics of the registered voters both statewide and within major regions of the state.
The sampling error associated with the survey results are difficult to calculate precisely because of sample stratification and the post-stratification weighting. Nevertheless, it is likely that findings based on the overall registered voter sample are subject to a sampling error of about +/-1.5 percentage points at the 95% confidence level. A more complete description of the survey methods used by the poll can be found on the Berkeley IGS Poll website at:
https://igs.berkeley.edu/sites/default/files/survey_methods_of_the_berkeley_igs_poll_2025.pdf.
Question wording
Do you approve or disapprove of the way Gavin Newsom is handling his job as Governor of California? Governor Newsom has been one of the nation’s most outspoken critics of President Trump in recent months. Some feel that the Governor should refrain from being so critical since it could negatively affect Trump administration policies toward California. Others feel the Governor should continue as a leading critic of the President. Which position would you rather Newsom take in dealing with the Trump administration?
To counter an effort by the state of Texas to redraw its Congressional district boundary lines to favor Republican candidates ahead of next year’s mid-term elections, Governor Newsom has proposed responding by temporarily changing the way California’s Congressional district boundary lines are drawn for next year’s mid-term elections to make them more favorable to Democratic candidates. In your opinion, do you think the idea of temporarily changing the way California’s Congressional district boundary lines are drawn ahead of next year’s mid-term elections to counter what Texas is doing is a good idea or bad idea?
Suppose a statewide ballot measure to change the way California Congressional District lines are drawn was put before voters in a special election later this year. The measure would ask voters to allow the state to temporarily replace the Congressional district lines drawn by the state’s independent citizens commission after the last census in 2020 for use in next year’s elections, if Texas goes forward with its own partisan mid-term redistricting plan. The measure would also return the authority to redraw California’s Congressional district lines to the state’s independent citizens commission for the next census in 2030. If you were voting today, would you vote YES or NO on this proposed ballot measure?


